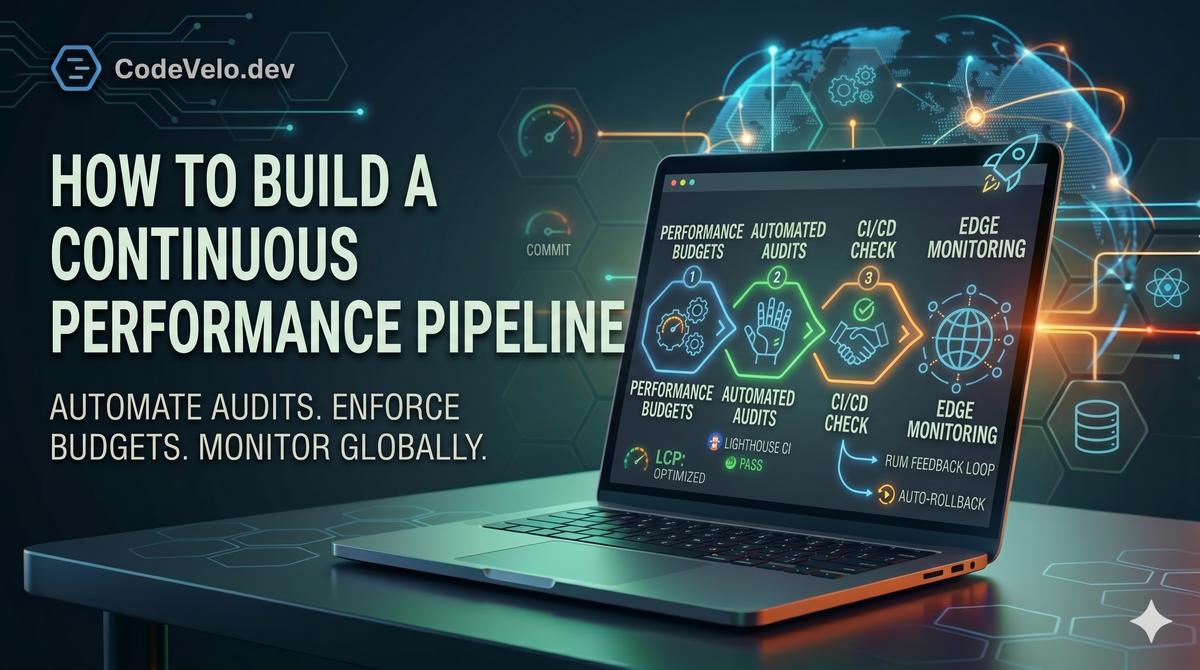
How to Build a Continuous Performance Pipeline
Don't just run one-time performance sprints. Learn how to build a Continuous Performance Pipeline that automates audits, enforces budgets in CI/CD, and uses global edge monitoring to guard your speed at every commit. If the code isn't fast, the build doesn't pass. 🏎️🛠️

The most common failure in web engineering isn't a lack of optimization; it’s performance regression. You spend weeks hitting a 90+ Lighthouse score, only for a single "convenient" library import or an unoptimized hero image in a Friday afternoon PR to tank your metrics.
At CodeVelo.dev, we’ve moved away from "performance sprints." Instead, we treat speed as a build requirement. If the code isn't fast, the build doesn't pass.
Here is how to architect a Continuous Performance Pipeline that guards your speed at every commit.
1. Automated Performance Budgets in CI
The foundation of a continuous pipeline is the Performance Budget. This is a set of hard limits on bundle sizes, image weights, and Core Web Vitals.
We integrate tools like Lighthouse CI or unlighthouse directly into our GitHub Actions.
- Static Analysis: The pipeline checks if the
main.jsbundle has increased by more than 5% compared to the production branch. - Lab Testing: A headless browser spins up a preview environment, runs a full audit, and fails the status check if the score drops below your threshold.
By catching these regressions in the PR phase, you ensure that performance is a shared responsibility, not just a task for the "performance person" on the team.
2. Shift-Left: Local Development Guardrails
Waiting for a CI runner to tell you the site is slow is too late. High-velocity teams shift performance testing "left"—closer to the developer's local environment.
As discussed in our Frontend Tooling Essentials for 2025, we utilize modern bundlers like Vite that provide instant feedback on module sizes. We also implement:
- Pre-commit Hooks: Using
huskyto run quick linting and size checks before code is even pushed. - Component-Level Benchmarking: Using Storybook interactions to measure the rendering cost of new UI elements before they are integrated into the main application.
3. Edge-Native Synthetic Monitoring
A site that is fast in a California data center might be sluggish in Sydney. Your pipeline must account for global latency.
We utilize Edge Deployment to run synthetic monitoring scripts from multiple global nodes. This allows us to detect regional performance degradation that a localized CI test would miss. By simulating real-world network conditions (3G/4G) at the edge, we get a realistic view of how our Caching Strategies are performing across the globe.
4. Real User Monitoring (RUM) Feedback Loops
Lab data is a starting point, but the "Real World" is the final judge. A continuous pipeline isn't complete without a feedback loop from actual users.
We stream RUM data (Interaction to Next Paint, Largest Contentful Paint) back into our observability dashboards. If a new deployment causes a spike in P99 latency for mobile users, our pipeline is configured for Auto-Rollback. This ensures that we Scale Without Sacrificing Speed—if a performance regression hits production, the system self-heals by reverting to the last known-fast version.
5. Incremental Performance Refinement
Performance optimization should be a Practice in Every Sprint. By utilizing React Server Components, we can incrementally move heavy logic to the server without needing to rewrite the entire frontend. The continuous pipeline monitors the impact of these shifts in real-time, providing the data needed to prioritize the next set of optimizations.
The CodeVelo Verdict
A performance pipeline turns speed from a "nice-to-have" into a structural guarantee. It removes the guesswork and human error from the optimization process, allowing your team to focus on building features without fear of breaking the user experience.
Ready to automate your performance? Let the experts at CodeVelo.dev audit your CI/CD pipeline and build a high-speed foundation for your team.